
Joint research by HKTDC Research and ACCA
Wing ChuSection Head, Business Advisory, HKTDC Research; Yuki Qian, Regional Head of Policy, ACCA China
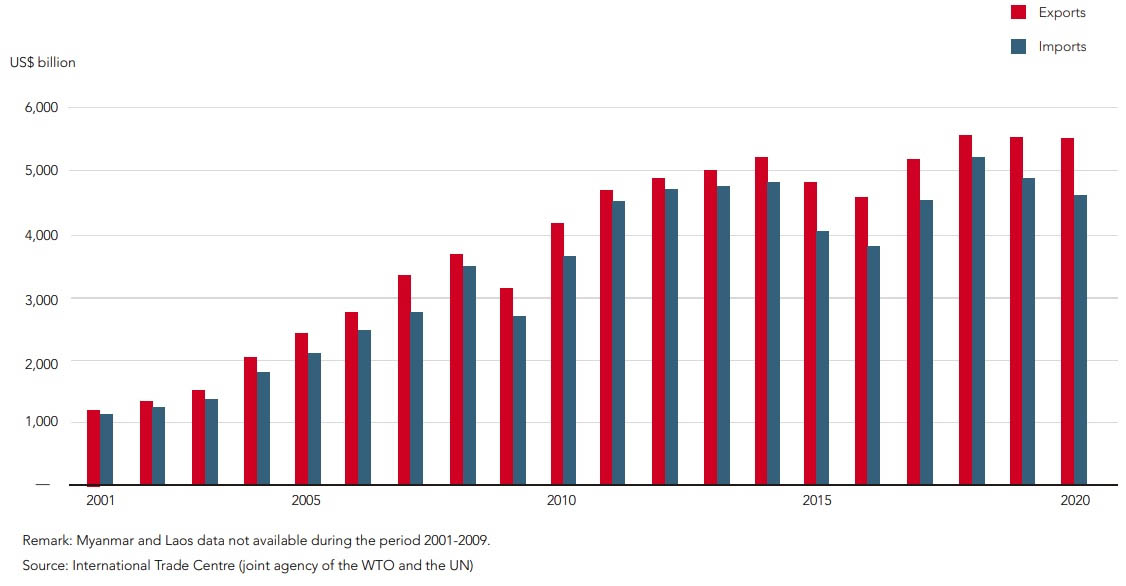
The RCEP facilitation measures are set to boost regional trade and economic co‑operation among the 15 members, who are already the major traders in Asia and Oceania. Their total exports and imports in 2020 amounted to some US$5.5 trillion and US$4.7 trillion respectively, constituting about 70% of the combined trading activities of the two regions [1]. Coupled with a few regional traders outside the RCEP, such as the major re‑export hub in the region, Hong Kong, as well as India and Taiwan, they together accounted for over 85% of the total trade of the two regions. When the RCEP agreement is implemented by January 2022 at the earliest, the trading activities of these major players are expected to grow further.
Total Exports and Imports of RCEP Members
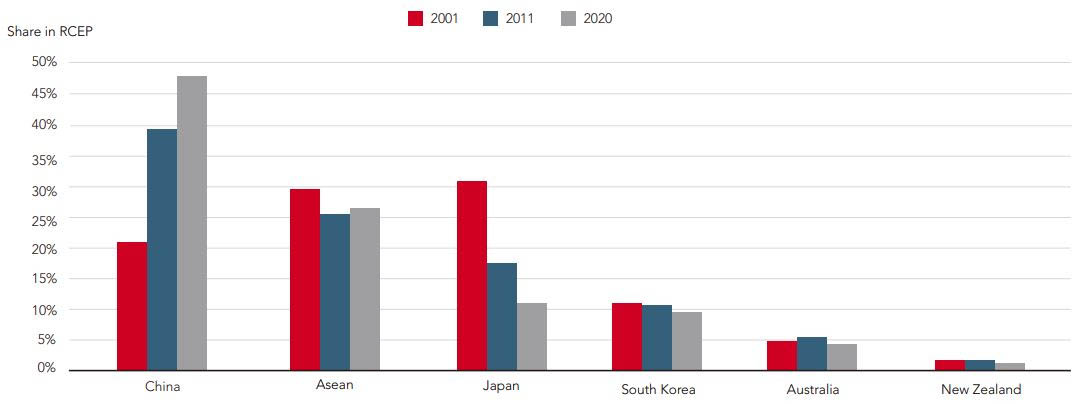
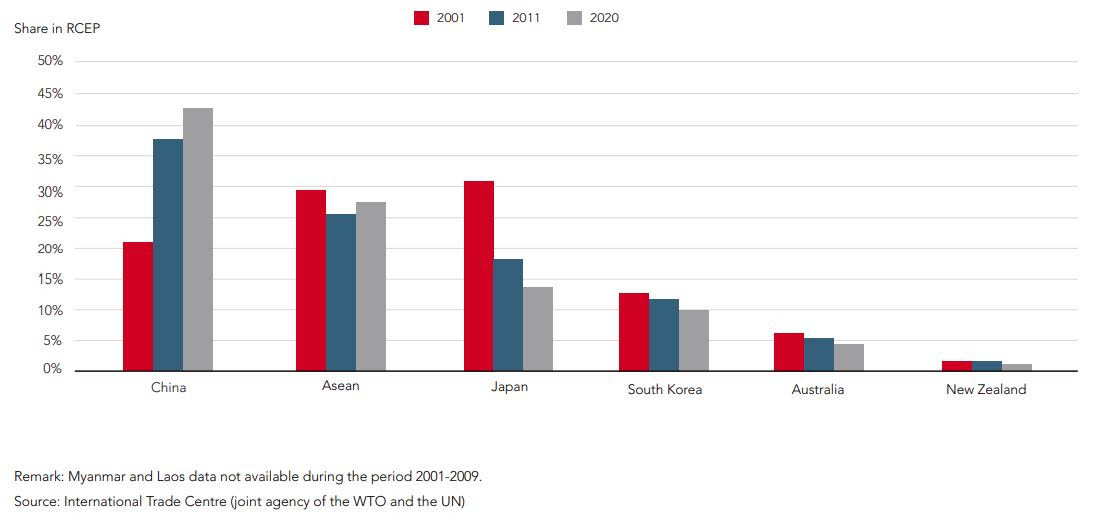
The trading activities of most Asian countries have been growing rapidly for the last two decades, thanks to the booming export‑oriented production. Not surprisingly, mainland China is the largest exporter as well as the largest import destination among the RCEP members. It accounts for 47% of RCEP exports and 44% of RCEP imports in 2020, both up from 21% in 2001, the year when the mainland joined the WTO. Despite mainland China’s remarkable performance, it is noteworthy that ASEAN’s percentage share declined only marginally (both ASEAN exports and imports, particularly those of Singapore, Thailand, Malaysia, Indonesia and Vietnam, increased strongly in value terms during the period), as global relocation of production and sourcing activities also benefited production sites in ASEAN.
South Korea also fared better, as the country maintained its high valueadded electronics and automotive production, which has facilitated the country’s export and import of a wide array of intermediate goods and industrial inputs. As for Japan, however, relocation of production to lower‑cost regions reduced its share of exports significantly from 32% to 12% in the period. Its share of imports likewise declined from 30% to 14% from 2001 to 2020. Australia’s exports have been boosted by the solid demand for raw materials and primary products on the back of the surge in global production. New Zealand’s share of regional trade has been dwarfed by the faster trade expansion of other members, although it has also shown steady growth over the period.
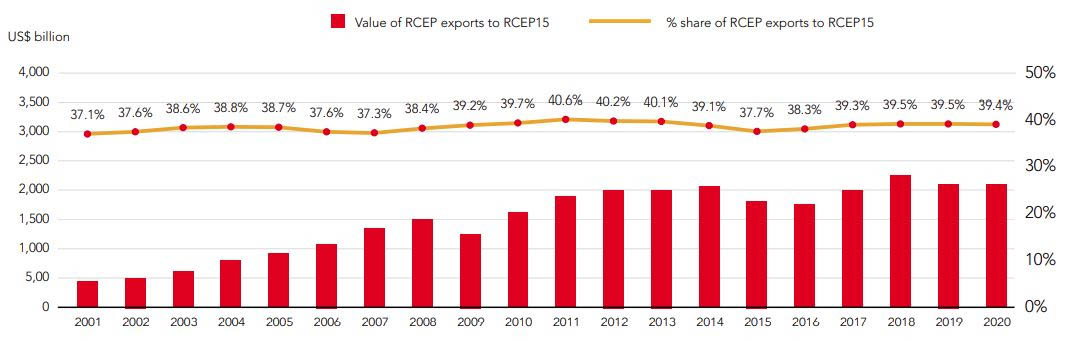
Exports of RCEP Members
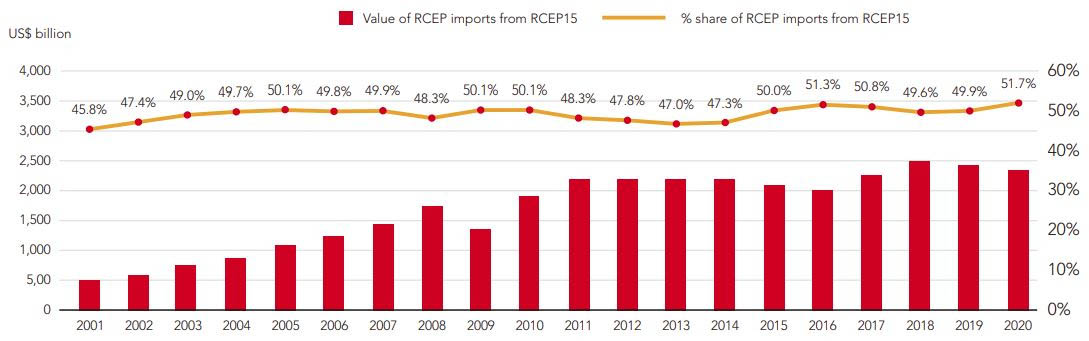
Imports of RCEP Members
Surging intra-regional trade
With the removal of trade barriers, the RCEP arrangements will stimulate trade among the members further. This is because trade expansion of the RCEP members in the last two decades is featured by the growing intra‑regional trade in Asia. Not only because of the booming export‑oriented production, but also thanks to the fact that division of labour in the industrial sectors have become more well‑defined in Asia, local companies and foreign‑funded enterprises as a result are striving to strengthen their businesses from a regional perspective. Such development will be aided further by the RCEP provisions in the medium term. Given RCEP’s trade and corresponding investment facilitation measures, businesses in the region will be encouraged to join hands with their partners along their respective supply chains to invest and expand their production capacities in different locations, and at the same time, re‑align their sourcing networks across Asia and beyond. Within the vast free trade area, they can optimise their business strategies and capitalise on local advantages to reduce production costs, while enhancing operational efficiency to meet their longterm development goals. Undoubtedly, the need for enterprises to transfer large quantities of industrial materials and semi‑finished manufactures to and from different production bases has already led to the rapid growth of intra‑regional trade in Asia. With the implementation of the RCEP arrangements, the intra‑regional relationship among the members will be strengthened further.
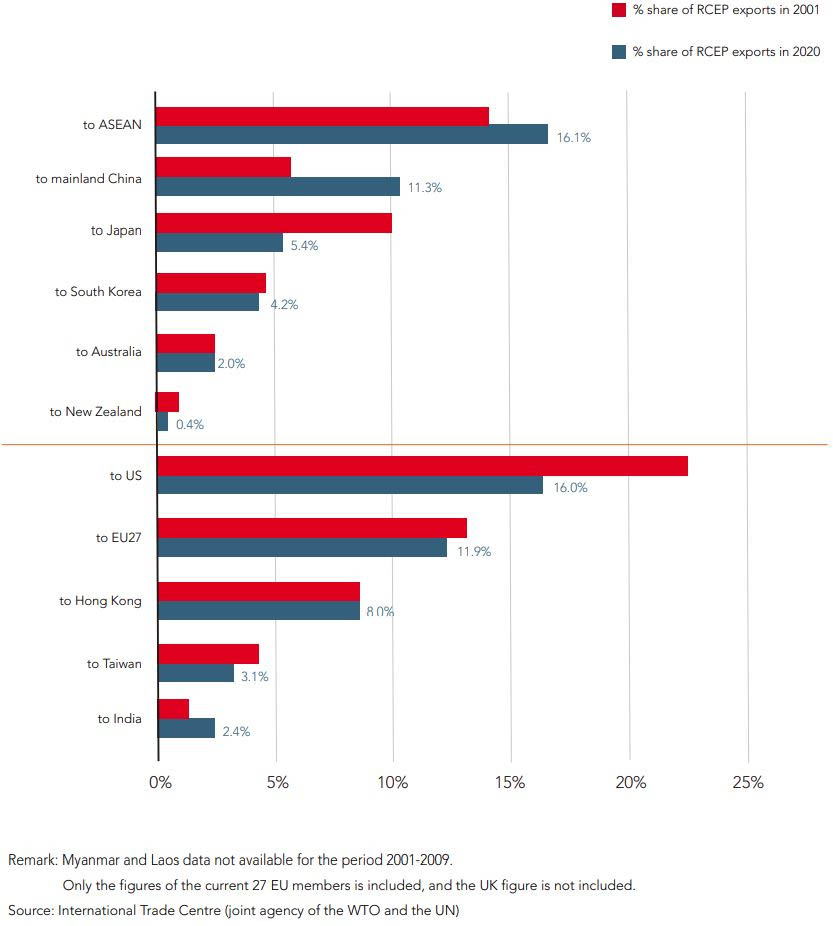
Almost 40% of the goods exported from different RCEP members in 2020, amounting to US$2,165 billion, were destined for “export markets” of the members themselves, up from the level of 37.1% in 2001 (US$474 billion). Not surprisingly, the ASEAN bloc and the mainland China are the most important destinations for such intra‑regional exports, absorbing 16.1% and 11.3% of RCEP’s total exports respectively in 2020, up from 14.4% and 5.5% in 2001. This is in contrast to Japan, whose share shrank from 10.1% to 5.4% in the same period.
RCEP exports to the US and EU markets increased in value over the period, but their shares declined steadily to 16.0% and 11.9% respectively by 2020. This is because the supply chain relationship between upstream and downstream enterprises in many industrial sectors in Asia has become increasingly close. The rapid expansion of intra‑regional trade has led to a contraction in the share of RCEP’s exports to the US, EU and other end‑user markets outside the region. Share of RCEP exports to Hong Kong's reexport hub has remained stable, but the share of exports to Taiwan has declined slightly. This is in contrast to the increase in the share of exports to India, where manufacturing production with a hefty reliance on imported materials has been growing in recent years.
Major Markets of RCEP Exports
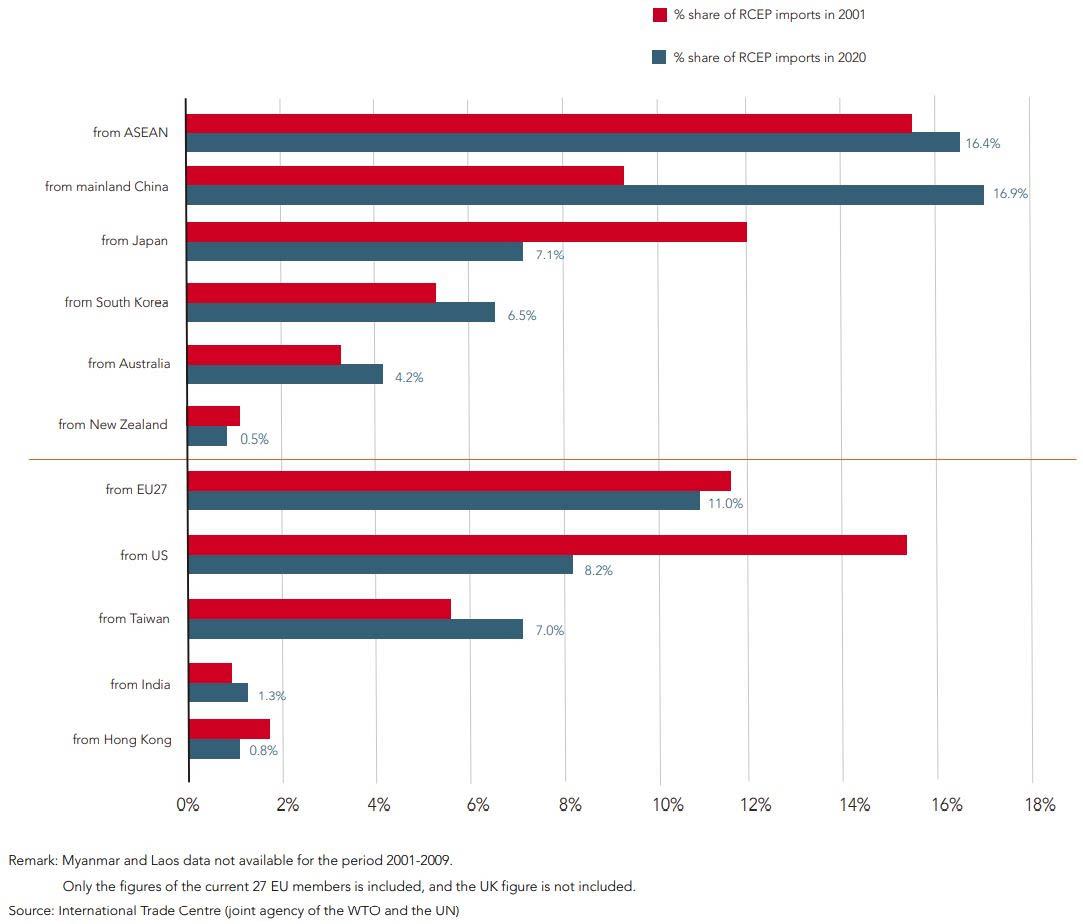
From the perspective of import sourcing, the interdependence of regional supply chains is even more obvious. Over half of the imports by RCEP members in 2020 (US$2,420 billion) were sourced from “RCEP suppliers”, up from the 45.8% level in 2001 (US$526 billion). The ASEAN bloc and mainland China are again the major sources of such intra‑regional imports. In particular, the mainland China has become the largest source, and its share increased markedly from 9.3% in 2001 to 16.9% of import sources in 2020. ASEAN was the second largest source of imports for RCEP members, with its share edging up from 15.6% to 16.4% in the period. Japan’s share shrank to 7.1% in 2020, while South Korea’s share edged up to 6.5%. The US share of the import sources declined markedly from 15.2% to 8.2% during 2001‑2020, due mainly to the massive relocation of the country’s production to Asia and other low‑cost regions. In contrast, the EU’s share declined only marginally to 11.0% in 2020, as the trade bloc has maintained its supplies of industrial goods like machinery and equipment to RCEP members in the last two decades.
Major Sources of RCEP Imports
Maturity of regional supply chains
The mainland and other advanced RCEP economies such as Japan, South Korea, Singapore and Australia, have already built up mature industrial production systems. Although some ASEAN economies only have relatively basic industrial foundations, most of them enjoy the comparative advantages of ample labour supply and low production costs. The lower‑cost ASEAN members are suitable for more labour‑intensive production. Some of the ASEAN economies can also manufacture industrial products that require more demanding inputs of technology and capital.
The industrial bases across Asia have re‑aligned to use their comparative advantages to engage in different upstream and downstream manufacturing operations, while strengthening their business co‑operation with foreign trading partners in the region. The rapid expansion of intra‑regional trade is a reflection of the increasingly close supply‑chain relationships built up among various production bases in Asia.
Capitalising on regional trade, upstream and downstream enterprises along the supply chains have started to specialise in their operations for division of labour. A wide range of raw materials, parts and components, and intermediate goods are thus produced, while certain materials and key parts and components are imported from abroad for the final assembly of various finished goods in Asia. These are then mostly exported to markets of consumer goods and endproducts in the EU, US and elsewhere in the globe. Asia will continue to remain the global centre for production and sourcing after the implementation of the RCEP agreement. Exports from RCEP members to other markets will grow, and this in turn will stimulate the development of sustainable supply chains among the members, fuelling the further expansion of intra‑regional trade as a result.
RCEP's Major Trading Product Categories
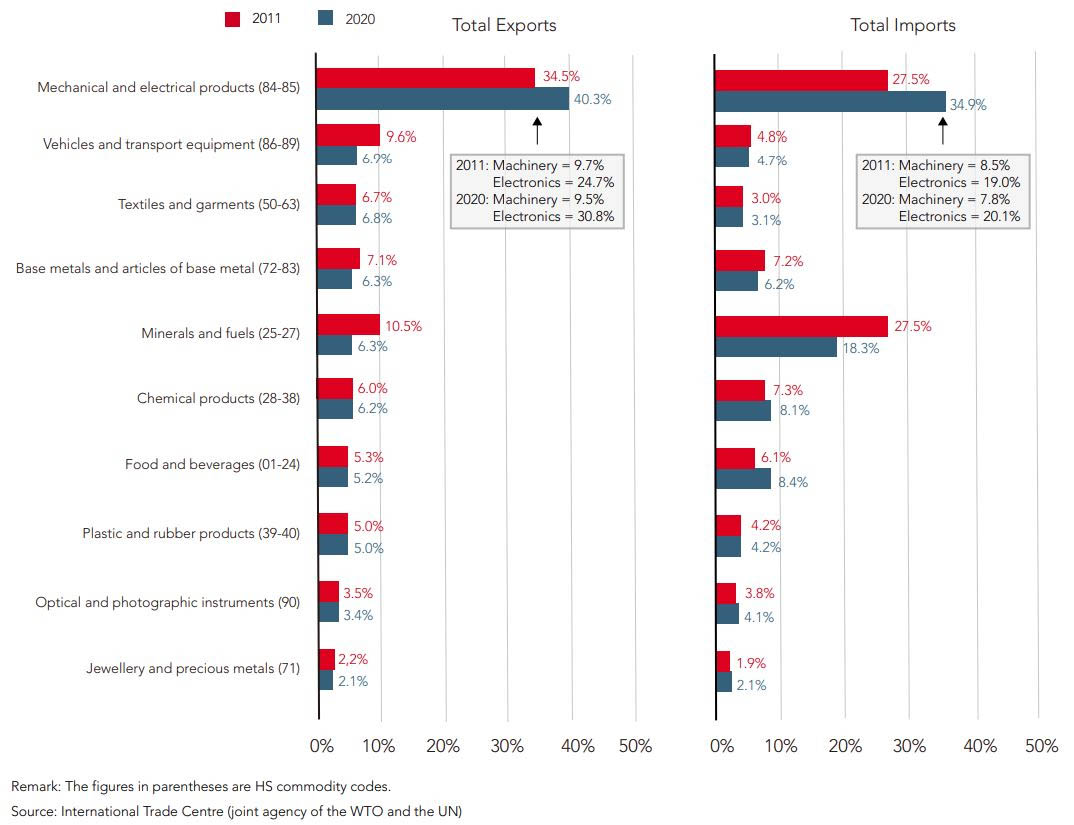
Mechanical and electrical products are the largest trading categories of RCEP members, accounting for 40.3% of their combined exports and 34.9% of combined imports in 2020. These include numerous mechanical, electrical and electronic parts and components for production use, as well as finished products for consumer markets. Other major trading items in 2020 included vehicles and transport equipment, and a wide range of raw materials, intermediate goods and other industrial items like minerals and fuels, textiles, base metals and chemicals. Finished goods such as garments and electrical appliances, as well as food and beverages and consumer products like jewellery, accounted for a smaller portion of the RCEP trade. These trading activities have the following characteristics:
- More than half of the products traded by RCEP members are primary and intermediate goods, including raw materials, parts and components for industrial use.
- Primary and industrial goods produced by RCEP members are largely supplied to production bases in the region, which drives the intra-regional trade among members.
- Exports of electrical/electronic end-products, garments and other consumer goods by members are largely targeted at consumer markets outside Asia, including those in the EU and US.
Booming industrial market opportunities
As regional supply chains mature, production materials will move more frequently between sites on the back of a barrier‑free environment. Industrial inputs, especially raw materials and intermediate goods, will be traded more frequently to match the production needs of the supply chains.
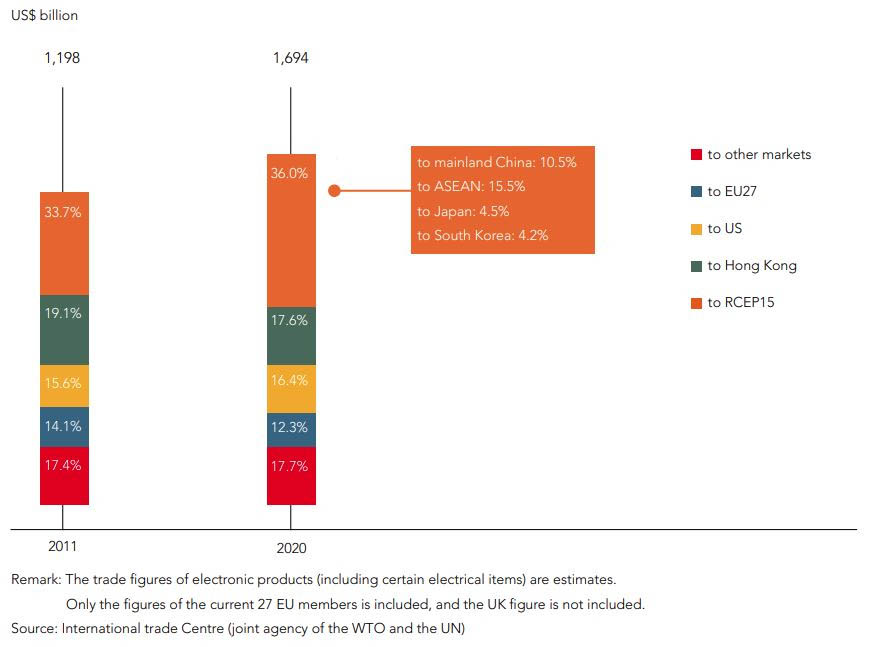
Notably, electronics (including certain electrical items) is the biggest single product category of most Asian countries and the RCEP members, accounting for 29.1% of the RCEP trade in 2020 (30.8% of exports and 27.1% of imports by RCEP) [2]. From 2011 to 2020, the value of electronics exports from RCEP members jumped from US$1,198 billion to US$1,694 billion, with an average nominal growth of 3.9% annually. The mainland China, which is by far the largest electronics manufacturer worldwide, was responsible for 53.8% of RCEP’s electronics exports in 2020. Advanced RCEP economies such as Japan, South Korea and the ASEAN country Singapore are important global sources of high‑end semiconductors and other key parts and components (6.2%, 10.2% and 8.5%, respectively). ASEAN member Vietnam has more recently become an important exporter of certain electronics (9.7%), thanks to the rapid expansion of assembly line production of mobile phones and related equipment by foreign investors in the country.
The lion’s share (36.0%) of such electronics exports goes back to the RCEP members themselves, with ASEAN countries and the mainland China being the two major destinations in 2020. Hong Kong, the major distribution hub in the region, received 17.6% of these electronics exports. This is in line with the fact that electronics is also the major export sector for Hong Kong, amounting to about two‑thirds of the city’s exports, with the majority being parts and components for assembly production in the manufacturing sites in the region. Other important destinations include the US and the EU, which absorbed 16.4% and 12.3% of RCEP electronics exports respectively in 2020.
Major Destinations of RCEP's Electronics Exports
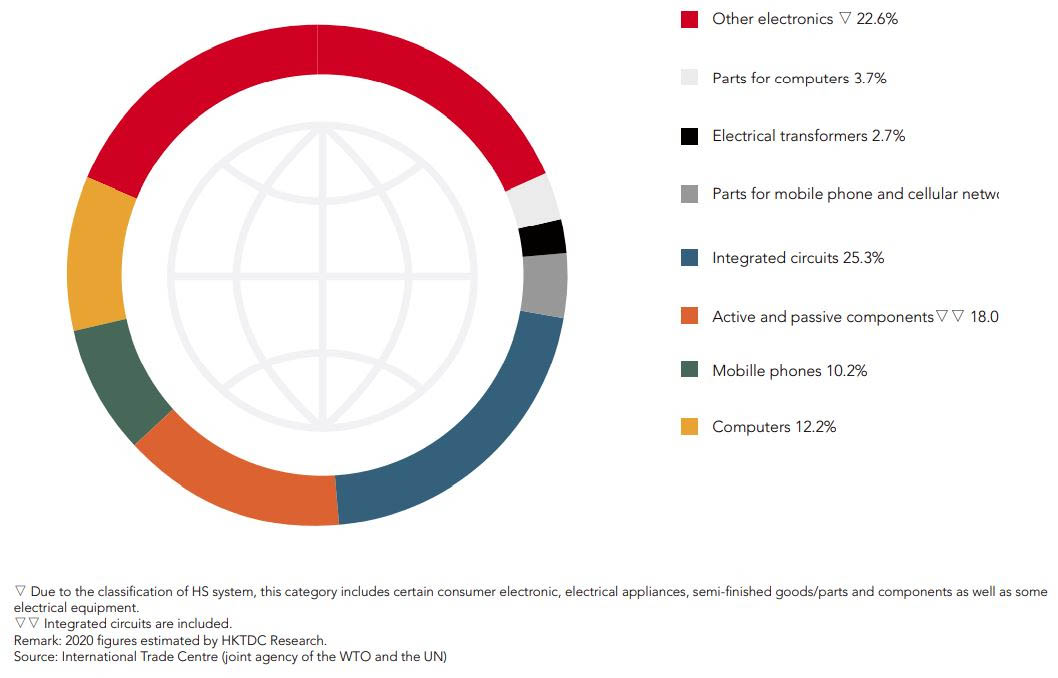
Interestingly, RCEP electronics exports include a huge selection of electronic parts and components and semi‑finished goods. In particular, integrated circuits from advanced economies like Japan and South Korea are the most frequently traded items, accounting for 25.3% of such electronics exports in 2020. Other major export categories in 2020 included a wide range of active and passive components (18.0%, integrated circuits not included), parts for mobile phone and cellular networks (5.3%), parts for computers (3.7%) and electrical transformers (2.7%). All these parts, components and other intermediate goods accounted for about 55% of total RCEP electronics exports, and largely go to other RCEP members themselves for further processing and/ or assembly production. Other export items include a wide range of finished products such as mobile phones, computers, audio‑visual entertainment products and other consumer electronics. Such finished products are mainly targeted at consumer markets in overseas countries like the US and the EU member states, which absorbed the majority of the finished electronics products exported by the RCEP.
Major Categories of RCEP's Electronics Exports
This article forms part of a joint study conducted by HKTDC Research and ACCA : “Tapping the RCEP Opportunities: Hong Kong to Maximise GBA’s Unique Edge as a Business Platform”
[1] In 2020, total trade of Hong Kong, India and Taiwan respectively accounted for 7.5%, 4.9% and 4.4% of the combined trade value of Asia and Oceania.
[2] The trade figures of electronic products (including certain electrical items) are estimates.

